Our specialties
Exams & training

Member benefits

View

State of the wait

The ‘State of the wait’ is our analysis of diagnostic imaging and cancer treatment waiting times, showing how many radiologists it would take to clear the imaging backlog in England.
LEARN MORE

A major reason for this backlog is workforce shortages. We have a 29% shortfall of clinical radiologists and a 15% shortfall of clinical oncologists, which means growing waiting times for patients who need timely treatment. This is why we’re calling on the government to prioritise the workforce by making sure its workforce plan is funded for the full fifteen years, and by addressing both long-term issues like training numbers and capacity, as well as immediate retention challenges.

Please share these figures on social media with #StateOfTheWait.

We’ll update these figures monthly, on the first Thursday of every month. If you would like to discuss the results, please contact the RCR’s External Affairs Team on: [email protected].

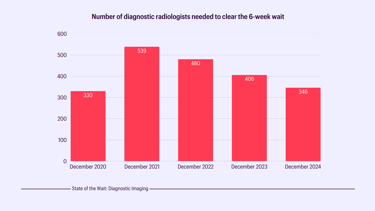
The NHS in England would have to employ more diagnostic radiology consultants overnight in order to clear the 6 week wait for CT and MRI scans in one month.* The figures below indicate how many more consultants would be needed to reduce the gap.

*This is calculated based on CT scans and MRI scans taking an average 15 and 20 minutes respectively to report.

State of the wait: Diagnostic Imaging (CT and MRI waits)

0more consultants

October 2023

For context, 367 CR diagnostic consultants equals a 9% increase in the current workforce. For comparison in October 2019, it was 34 radiology consultants.
0more consultants

August 2023

For context, 397 CR diagnostic consultants equals a 10% increase in the current workforce. For comparison in July 2019, it was 41 radiology consultants.
0more consultants

July 2023

For context, 386 CR diagnostic consultants equals a 10% increase in the current workforce. For comparison in July 2019, it was 43 radiology consultants.
0more consultants

June 2023

For context, 381 CR diagnostic consultants equals a 10% increase in the current workforce. For comparison in June 2019, it was 49 radiology consultants.
0more consultants

May 2023

For context, 372 CR diagnostic consultants equals a 9% increase in the current workforce. For comparison in May 2019, it was 53 radiology consultants.
0more consultants

March 2023

For context, 406 CR diagnostic consultants equals an 11% increase in the current workforce. For comparison in pre-pandemic March 2019, it was 31 radiology consultants.
0more consultants

February 2023

For context, 404 CR diagnostic consultants equals a 10% increase in the current workforce. For comparison in February 2020, it was 40 radiology consultants.
0more consultants

January 2023

For context, 500 CR diagnostic consultants equals a 13% increase in the current workforce. For comparison in January 2020, it was 63 radiology consultants.
0more consultants

December 2022

For context, 480 CR diagnostic consultants is equivalent to 12% of the current workforce. For comparison in December 2019, it was 50 radiology consultants.
0more consultants

November 2022

For context, 410 CR diagnostic consultants is equivalent to 10% of the current workforce. For comparison in November 2019, it was 36 radiology consultants.

See our latest updates, policy reports and initiatives.

News & policy